Learning and Discussion of Innovative ideas about Mining Waste Management and also Mining Related News and Activities

  • Mine Waste Management Training

    Mine Waste Management Short training sponsored by Government of Japan through JICA in corporation with the Government of PNG through CEPA, MRA and DMPGM.

  • Kasuga Gold Mine in Kagoshima, Japan

    Partial Assistance to Masters and PhD Candidates in filling Application Forms for Japanese Scholarships or Self Sponsor

  • Mining Warden Hearing at Ok Isai Village, Frieda River, East Sepik Province, PNG

    Landowner grievances is always a challenge for the PNG Mining Industry. However, the Regulators of the Mining Inductry facilitate Mining Warden Hearings and Development Forums to address grievances related to mining.

  • Osarizawa Underground Mine Adit

    Osarizawa Underground Mine is an abandoned mine in Akita Prefecture, Japan. Event though the mine is closed, the mine site is kept for sightseeing purposes.

  • Hidden Valley Tailings Storage Facility (TSF)

    Mine Waste refers to the waste related to mining activities such as tailings and waste rock. Management refer to how the mine derived waste is managed by the operator and or the Regulatory Body.

Thursday, 6 February 2020

Analysis of Flood in Mul District that caused 6 lives and Catastrophic destruction to properties

The flooding of Kuma Creek has caused massive destruction to properties and confirmed six fatalities downstream. Kuma Creek is such a small creek which is  a tributary of Gumanch River which joins with other rivers to form the Wagi River in the Western Highlands Province.

It is unbelievable for such a small creek to cause massive destruction to lives of people and properties downstream. According to preliminary report posted on Facebook dated 4th February 2020 by Stanley Kheel Kewa, it reads: 

"Preliminary reports from Mt Hagen confirm massive scale of destruction by the Kuma river a tributary of the Gumanch river in Mul district of Western Highlands Province. Four adults and five children totaling nine casualties as reported deaths now. More investigations are in progress as surrounding communities are assessing and investigating the magnitude of the destruction.
Local tribes in the area are the Nengka, Munjika & Mele tribes. Locals reporting from Hagen say this is one of the worst natural disasters the community has ever experienced since time immemorial. The Kuma & Gumanch rivers originate from the top peak of the highest mountain range in WHP known as the Mt Hagen range from which the current Hagen city got its name.
The Nengka Kuiprungils, Nengka Oiyambs and Munjika Rapgangils live at the edge of the Hagen range with houses and gardens patched along the Gumanch and Kuma tributaries.
Ken Paul is a local from the area and reports he is in Hagen town trying to mobilize disaster office and news personnel into the area for further investigations and reporting.
This is just a preliminary report with photos of the disaster zone downloaded from fb pages."


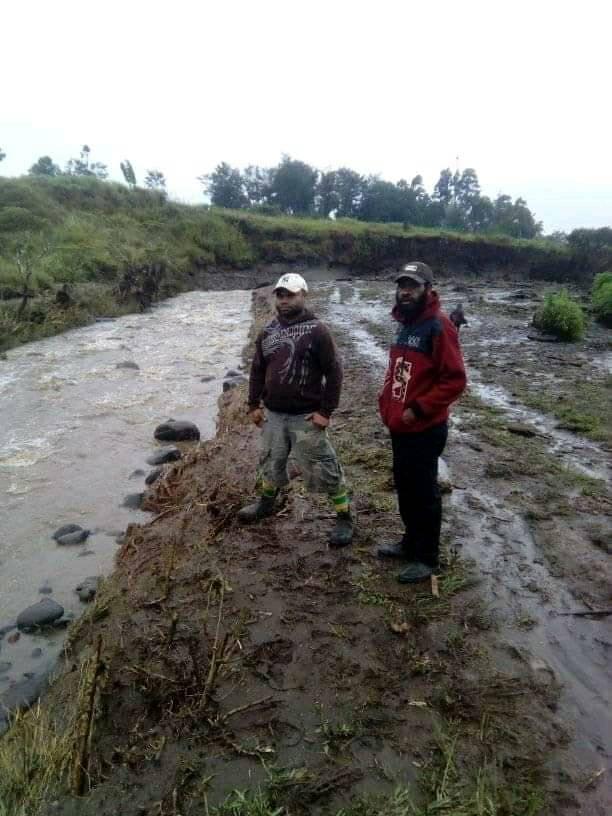
Locals on site - photo courtesy of Facebook


Photo Courtesy of The National Newspaper
Debris of flood - Photo courtesy of facebook
MarapanaVillage aftermath - photo by National newspaper


Now,
one would wonder with questions in anticipating superstitions without establishing the facts and without even having a curiosity in mind. The possible cause of the flood can be best explained as follows;


There must be couple of landslips
caused by what is believed to be over saturated water-table/reservoir
contain by permeable rocks
at both steep
sides of the wedge walls/hills
of  Kuma Creek which is indicated on the snapshot below. 
Then the slipped materials must have
formed an embankment or base which blocked the upstream and the water built up at the upper end of the embankment which formed a temporary mini dam. 


As the mini dam rose with altitude, the stress build up also increased until it reached a

bursting failure in which debris of embankment together with other slipped materials along the creek's
pathway were all washed away and flooded the banks of Kuma and Gumanch Rivers which caused the catastrophic destruction to properties and fatality of 6 human lives. 


The mass flow of loose materials which blocked the flowing river which resulted in forming a mini dam were not competent or strong enough to withstand the pressure/stress build up at the upper end of the blockage, it then burst out and flooded the downstream at a greater momentum which is possible for massive destruction.
So sad that  many loved ones lost their lives due to the catastrophic disaster caused by this unusual flood.
Expected failed area
Location Failure is Expected


Marapana Village
Ariel view of Kuma,Tagla Kwip and Marapana
Note  that this analysis is based on opinion only and not substantiated with facts. If someone wants to proof with factual information then someone need to take a walk up the Kuma river and look for any trace of landslip. If that is so then that would be the cause of the flooding. 

To prevent properties and lives, build houses on higher grounds and also build flood walls along the river banks where valuable properties are installed. Do make awareness to kids and matured people to evacuate quick if unexpected signals are given before massive destruction happens again.


Share:

Monday, 3 February 2020

Geothermal System Modelling - Basic Model

Geothermal System Modelling
Report Submitted by Group Fuji
Basic Model
1.0       Introduction

The Basic Model  parameters (basicmodel.in) was used to calculate the transient behaviour of the hydrotherm system up to 100,000 years. Team Fuji analysed the calculation results in the numerical model by changing one of the parameters in the initial model and run the simulation using HYDOTHERM. In this case, the team changed the size of the heat source while keeping the other parameters constant in the model. The calculation results were run at 20000,40000,60000,80000 and 100000 years.

The physical modes of each scenario are demonstrated in the following model diagrams (Fig. 1-5) below. Heat Source is shown at the centre at 4km x 4km x 2km for the basic model which is represented in red cubical color. The size of the heat source is decreased by 3km x 3km x 2km and then increased to 6km x 6km x 2km in that order. Two different input file  with the different  sizes in X and Y direction  (heat source dimensions only) were run using  Jupiter post-processor (Hydrotherm program). After the simulation in the series of years mentioned above, temperature and flow variation were used to explain the trends in cooling rate of the heat source and temperature variation with time, corresponding analysis is illustrated in the discussion section.

Fig. 1 Heat source at the deeper layer
 of the model (2km thick) 
  Fig. 2 Section View of the initial
 model


Fig. 3 Overview of the initial block model
  Fig. 4 Section view of the block model when heat source decreased to 3km x 3km


Fig. 5 Sectional view of the block model when increasing the
 size of the heat source by 6km x 6km
                               

Note: everything else is kept constant except the size of heat source changed for the next two models.

2.0    Discussion

1.1 Heat source

The trend of the cooling equations (below) illustrate the differences in the thickness of the heat sources. Therefore, the larger the areal extent of the heat source is inverse proportional to the cooling rate.  The bigger the heat source, the longer it takes to for it to cool down.


Figure 6: Cooling rate of the heat source
The cooling equations for the model with 3kmx3kmx2km, 4kmx4kmx2km and 6kmx6kmx2km heat sources are shown below:

respectively.


1.2  Rate of cooling of the reservoir


The graph below portrays the cooling rate of the reservoir, approximately 1km above the heat source where the convective heat transfer currents are mostly upwelling.


4kmx4kmx2km heat source


Figure 7: Cooling rate of the reservoir

The reservoir cooling curves in Fig.7 above have near - similar trend except for the model with 6kmx6kmx2km heat source which has a kink upwelling at 40,000 years.


1.3 Interstitial steam and water flow

1.3.1        3kmx3kmx2km heat source model


At 20,000years, the hot water rises from the center of the model and travels upward towards the surface as interstitial water moves slowly to recharge the reservoir. At 40,000 years, the rising hot water together with the conduction heat transfer heats a larger area above the magma thus expanding the reservoir area (region in which hot water rises upward).  From 60,000 to 100,000 years, the model cools to below 200°C and convective currents carrying hot water upward weakens over time.
Figure 8: Simulation of 3km x 3km x 2km heat source after 20000 years.


1.3.2        6kmx6kmx2km heat source model

At 20,000years, we have two convective upflow regions which may form two reservoirs about 1km on either side of the center of the model (approx. 9000m and 11000m from LHS of the model).


At 40,000yrs, the two reservoirs merge into one as the heat source cools with convective currents weakening as the model ages all the way to 100,000years.
Figure 10: Simulation of 6km x 6km x 2km heat source after 40000 years.


3.0     Conclusion

In this study, only the heat source dimensions were varied without any change in other parameters.  The results were then evaluated and discussed using that assumption.

The areal extent of the heat sources directly influences the convective flow of fluids and temperature. However, transient temperature evaluation indicates that the rate of cooling of the heat source is inversely proportional to the size of the heat source. The larger size (6km x 6km x 2km) of the heat source allows for a longer period of high-temperature fluid convection. 


Figure 12 : 3X3 Heat source       Figure 11: 6X6 Heat source


Source: Groupwork Hydrotherm Basic Model Assignment Report -
Contributions to Group Fuji:

Islomove Sunnatullo-Rock Engineering, Koskey Philemon Kiprotich- Geothermics, Gilbert Bett Kipngetich-Geothermics, Gutierrez Donaire Kevin Yamil - Geothermics, Haissama Osmanali - Geothermics, Kuri Las - Rock Engineering, Lim Pagna-Economic Geology, Mwangi Samuel Muraguri -Geothermics, Ngethe John-Energy Resources, Omondi Philip Omollo-Geothermics, Samod Yuossouf Hassan - Economic Geology

Share:

Thursday, 2 January 2020

Frieda River (SMLA9) Mining Warden Hearing

Frieda River copper and gold project is located at the border of East and West Sepik. The holder of the exploration license EL58 lodged an application  for a Special Mining Lease on 24th june 2016. This date is the date at which the application was registered by the Registrar of Mineral Tenements. This process is pretty much similar to that of land lease process.

As per the process, the Registrar upon registration gives notice to the Chief Mining Warden and other officers for technical appraisal. This triggers the next procedure which is the Warden Hearing Process. the Chief Warden together with the registrar fixes a date and time and venue and notify impacted stakes holders regarding the hearing. This is a public forum for the impacted stake holders where the views of the impacted people are gauged.

As such, the above process were followed and Mining Warden hearing was conducted at several venues. The Application was not only the SML application but some other auxiliary leases as well such as lease for mining purposes (LMP), Mining Lease, Mining Easements (ME). To cater for all these leases, there were several venues fixed for hearing. the impacted communities of the Frieda River Project include but not limited to the following:
* Wabia village
*Ok Isai Air strip
*Kubkain village
*Iniok Village
*Aum 3 Village
*Wemimin 1 & 2
* Hotmine Mission Station

The Views of the people were gauged and report compiled for further deliberation. The views of the people were either supportive or objective. The the job of the mining warden is the record all good or bad comments and compile report and also give his/her view.

The other part of the technical assessment is another process which is dealt with by the technical assessment team.
Chief Mining Warden, Andrew Gunua was  Conducting Mining Warden Hearing at Ok Isai, for the Frieda River SML 9 Application in the West Sepik Province 

Share:

Monday, 16 December 2019

Introduction to Mineral Processing- Questions and Answers


S
1.       Write down the main objective and technological summary of mineral processing on mining industries.

The main objective of mineral processing in mining industries is to separate the gangue minerals from the valuable or target minerals or the desired minerals. The desired or valuable minerals are fixed within the ore. The target minerals are to be liberated from the ore and gangue minerals are disposed of.

The summary of the mineral processing technology is in the following sequence:
·        Rock drill & blasting of Ore
·        Crushing & Grinding (Liberation)
·        Sieving & Classification
·        Separation, Extraction, Concentration
·        Concentrate & Metallurgical Treatment
 
 2.       Describe what kind of technology is important for securing resources (or resource supply), including the reason and your idea.

The crushing and grinding technology is very important in securing resources because without crushing or grinding you cannot go further. Crushing and grinding are the only primary actions for further downstream processing. After crushing and grinding you can look for other alternatives of screening and separation and further downstream processing techniques that suites the recovery of target mineral.

For example, you can’t recover in-situ or ROM gold by leaching if there is no fracture to expose gold surface interaction with cyanide solution.  You cannot proceed with flotation if you have not crushed and ground the materials to expose the surface of mineral particles 

3.       It is required to process a low grade ore in which the primary mineral is chalcopyrite associated pyrite. Suggest a process flowsheet, a reagent scheme and a set of operating conditions that may optimize the recovery of copper while minimizing the recovery of pyrite. Explain the reason that led to your decisions.

Froth Flotation process is best for recovering Chalcopyrite. Both Chalcopyrite and pyrite are in pregnant solution at lower pH value. In order for us to separate Chalcopyrite from pyrite, we need to regulate the pH value in the flotation. This can be done by introducing lime and alkaline reagents into floatation thank so that the pH is increased above 6. The pyrite will then precipitate at pH above 6 and the chalcopyrite floats as bubble which is separated from pyrite.

 4.       What kind of technology development do you think is necessary for the mining and mineral processing, which is expected to become difficult in future?
Describe with your idea.

The development of processing technology would be a challenge to recover very low grade ore which is regarded as waste materials or tailings. It is assume that the tailings at least contain some valuable minerals but are hardly recoverable using the metal recovery techniques. It is normally allowed to pass through as tailings into the tailings dams or discharged into the river or on to the seafloor.

Some researchers have come up with proposals to recover low grade ore with a concept of  near zero waste through bio-leaching processing techniques but it will be a challenge whether such technology will truly help to recover very low grade ore mixed with silts and fine particles of rocks and soil.

Share:

Tuesday, 8 October 2019

Small Scale Mining in Papua New Guinea (PNG)

Small-scale mining in Papua New Guinea was practiced for more than a century when the first ever gold discovery was done in the Sudest Island in in the Milne Bay Province in 1888. The small-scale mining operation then extended to other neighbouring islands of Missima and Woodlark and further to the other parts of Papua New Guinea.

It is also known that about 100 years ago there were also miners mining on the Yodda and Gira fields in Oro Province and 10 years later at Lakekamu in Gulf Province in 1920s. These discoveries led to the development of major mining operations in Papua new Guinea.

Gold is still actively produced in Bulolo Wau area as well as other areas in PNG today.

The early miners were able to open up the Highlands in the 1930's and located gold at Kainantu, Kuta and Porgera. Others discovered the Sepik areas and found gold at Maprik and Amanab. The early miners also mined at Kupai on Bougainville near the closed Panguna Mine.

Gold remains an integral part of the cash economy in areas where gold has been traditionally mined. The local landowners are testing their own land and finding new gold anomalies throughout PNG.

There are more than 50,000 to 60,000 small scale gold miners working at various alluvial gold districts throughout he country using various mining methods.

The most commonly known basic mining methods are sluicing and panning. The miners sometimes use water pump and other motor powered machines in their operation to either go semi-mechanised or fully mechanised.

Abandoned Trommel at Tuguba River Mine Site in Tamo, East Sepik Province

Mechanized Mining Equipment Parked at an alluvial mine site at Tuguba River, Tamo in the East Sepik Province


Note:
The this article is an extract from a publication by Department of Mining Papua New Guinea,2001.


Share:

Sunday, 29 September 2019

Tailings Dam Construction in Papua New Guinea a Challenge

Tailings dam constructions in Papua New Guinea (PNG) are faced with natural factors such as  high altitude with high rainfall (2000-5000mm), active seismic zone and other geotechnical structural factors which pose threat to the stability of tailings dam and potential failure.  As such, the PNG government has allowed mining companies to discharge tailings into the river systems over the last 30 to 40 years which pollutes the riverine and ecology within the vicinity of the mine impacted communities downstream.  However, the PNG Government intend to discourage riverine tailings disposal and encourage tailings dam construction in PNG.

The current tailings dams in PNG include Hidden Valley Tailings Storage Facility(TSF) and K92 Mine Tailings Dam.

The Porgera Gold Mine discharges its tailings into the Strickland River in the Enga Province. The Ok Tedi Copper and Gold Mine at the Mt.Fubilan, Tabubil in the Western Province discharges its tailings into the Ok Tedi River System.

The Lihir Gold Mine in the Luise Caldera of New Ireland Province places its tailings onto the deep sea floor (DSTP).

The Ramu Nickel and Cobalt Mine at Kurumbukari in the Madang Province also practice the deep sea tailings placement (DSTP).

The Wafi Golpu project is an advanced project with the Special Mining Lease Application lodged with the Mineral Resources Authority and is under technical appraisal by government at its engaged  independent consultants. This project proposed for a DSTP.

The Frider River Project proposed for an Integrated Storage Facility which will contain waste rock and tailings at the same time. The dam will also but used as hydro-dam to generate electricity.

The government of Papua New Guinea will never or might not allow riverine tailings discharge for all future mines in the country. It would be either by practice of building of Tailings Storage Facilities of place them one deep seafloor.
Share:

Thursday, 9 August 2018

Financial Performance Analysis of a Mining Company (Simple Example) - Mineral Economics

1. Analyze the financial performance of the Lihir Gold Limited for 2006. Given the Balance Sheet and Income Statement, calculating the following ratios and interpret the results.

 i.  Analyze the Liquidity/Solvency
This measures the firm’s ability to meet short term obligations i.e. debt payment.

a) Net Working Capital
 Net Working Capital = Current Assets – Current Liability
                                    = U$ 132,700, 000 –US$ 207,300, 000
                                     = – US$ 74,600, 000
Net Working Capital shows that Lihir is not capable of meeting its short term obligation. The current assets could not meet the current Liability.

 b) Current Ratio

Current Ratio= Current Assets/  Current Liability     = U$132 700 000/ U$207 300 000= 0.64
                         

Mining’s CF is highly predictable so current ratio of over 1 or 2 is acceptable. Thus Lihir has no short term debt paying ability because current ratio is less than 1.

c) Quick Ratio

Quick Ratio = Current Asset – Inventory/  Current Liability
                     =  U$ 132,700, 000 –U$75300 000/U$ 207300 000 
                     = 0.277
                                         
 Quick ratio> 1 is desired, so Lihir has no immediate ability to meet current debts.

 ii. Analyzing Activity
Activity ratios are used to measure the speed at which various accounts are converted into sales or cash.

 a) Inventory Turnover – shows how soon the inventory will be converted to cash.

Inventory Turnover = Cost of goods sold /  Inventory  = U$ 268100 000 / U$ 75300 000= 3.56
                                             
Exploration expenses = US$ 6000 000 is an expense

Therefore; Inventory Turnover = Cost of goods sold /  Inventory
                                                  = US$ 262100000 / US$75300 000 = 3.48
                                                                 

Inventory turnover is useful only when compared with that of other firms with same industry. For Mining and Petroleum inventory turnover is between 5- 10. However, Lihir has less than that (i.e.3.48) so inventory turnover is very poor. And the number of days required to convert inventory into cash is 360days/3.48 = 103.45 days.


b)Average Collection – average amount time required to collect accounts receivables

Average Collection Period = Accounts receivables /Average Sales/day

                              =  U$4600 000  /U$ 310400 000/360           = 5.3 days
                                                     

The average collection period of 5.3 is indicative of good managed credit collection or credit department.

c) Average payment period – average amount of time needed to pay accounts payable.

 Average Payment period = Accounts payable/ Av. Purchases/day*% of goods sold                     
                                         

US$ (268.1M – 6M (Exploration expense)) = US$ 262.1 M Cost of goods sold;

Average Payment period = US$ 46 600 000 /US$ 262100 000/360 * 0.84 = 76.2
                                        = 76.2 days to pay for credit purchases

 If the credit purchase term is 30 days, financial analysts could give Lihir low credit rating because 76.2 days to payback credit purchases is unacceptable.

 d) Fixed asset turn over – measures the efficiency with which bthe firm has been using its fixed, or earnings, assets to generate sales.

 Fixed assets Turnover =   Sales  /Net fixed assets
                               = US$ 310 400 000 / US$ 86200 000 = 3.6
                             

This means Lihir Mine Ltd’s turnover on its fixed assets is 3.6 times a year. It indicates fixed assets are efficiently used to generate cash flow.


 e) Total asset turnover – indicates the efficiency with which the firm uses all its assets to generate sales.

Total assets turnover = Sales /Total assets   = US$ 310 400 000 / US$ 1 496 000 000  = 0.21
                                     
The overall efficiency of using assets to generate sales is 0.21 which is not a good reflection. It could mean assets are old and need replacement.


iii)Analyzing Debt

a) Debt ratio- measures the proportion of total assets financed by the firm’s creditors.(the higher the ratio reflects greater amount of other people’s money used in an attempt to generate profit)

 Debt ratio   = Total liabilities / Total Assets       = US$ 684 100 000 /US$ 1 496 000 000
                                                                             = 0.457 = 45.7%
                                   
This indicates Lihir has financed 45.7% of its assets with debt which is good.

 b) Debt equity ratio – measures the ratios or long-term debt to stockholders equity. It generally measures the degree of financial leverage of the firm.

Debt Equity Ratio = long term debt /Stockholders equity = US$188 600 000 /US$ 811 900000 =3.23%
                                           
It means Lihir applied 23.23 % debt to procure long – term assets which is lower debt – equity ratio. This indicates that it has a stable cash flow debt that can be paid at a shorter period of time.

c) Times interest earned ratio – measures the firm’s ability to make contractual interest payments.

 Time interest earned = earnings before interest & taxes (EBIT)/ Interest Expense
                                               
                                 =  US$ 80 700 000  / US$(1 400 000 + 6 200 000) = 10.2
                                   
 Lihir time interest earned is 10.2. As a rule, a value of 3 to 5 is a good margin for safety from shrinking and liquidation. However Lihir has exceeded that margin and indicates that Lihir is able to fulfill its interest servicing.

d) Fixed payment coverage ratio – measures the firm’s ability to meet all fixed – payment obligations such as loan interest ,principal, lease payments and preferred stock dividends

Fixed payment coverage ratio
=  EBIT + Lease payments / (  Interest + lease pmt + { ( prin.pmt + preferred stock div) x (1/(1-T))})
   
=   *(US$ 80 700 000 + 0  )/ (      US$ 1 400 000 + 0 +{( 30 600 000 + 0) x (1/(1 – 0.3))}) = 1.7

Note: Principle payment is obtain from year 2005 and PNG Income tax is 30%. No lease payment and no preferred stock dividend for year 2006.

iv. Analyzing profitability 

a) Gross profit margin – indicates the efficiency of management in turning over company’s goods into profit.

Gross profit Margin = (Sales - Cost of Goods sold)/Sales
                                 =   (US$ 310 400 000 – US$ 268 100 000 )/ US$ 310 400 000 = 13.6 %

Exploration expenses = US$ 6000 000 is an expense

Therefore Gross profit Margin= US$310.4M – US$(268.1 - 6)M/   US$ 310.4= 15.56 %
                                                             

The gross profit margin in 2005 is -4.57% or the company has received less revenue. However it has improved in 2006 with gross profit margin of 15.56%.

b) Net profit margin – measures the profit produced by each dollar of sales.

 Net Profit Margin = Net profit after taxes/  Sales  =  US$ 53 800 000 / US$ 310 400 000   = 17.35 %
                                                           
In 2005, the company has net profit margin of 19.0 % and in 2006 with the net profit margin of 17.35%. So in 2005 there is slightly improvement in profit produce by each dollar of sales.

 c) Return on assets (ROA) – measures the overall effectiveness of management in generating profits with its available assets.

 Return on Assets = (Net profit (before extraordinary items) + income tax + Interest )/Average total assets
= (US$ 53 800 000 + US$ 22 100 000 + US$ 1400 000 )/((US$ 1496 000 000 + US$ 1319 400 000)/2)
 = 5.5 % Return of assets
This shows that company has profit earning power using its limited available assets.


d) Return on equity 

Return on equity = net profit – preference dividend /Average stockholders’ equity
                               
                            = ( US$ 53800 000 - 0 ) / (US$1496 000 000 + US$ 1319 400 000)/2   = 3.8%
                               

For every dollar of strockholders’ equity, there is 3.8% return accruing to the stock holder.

 e) Earnings per share – use by stock investor to compare different companies on the basis of earning power of the firm’s each outstanding share on common stock.

Earnings per share = net profit (before extraordinary items) – preference dividend
                                             Number of ordinary shares issued (outstanding)
                     
                                 = (US$ 53 000 000 – 0 )/1284 049000
                                 =US$ 0.041
The EPS of US$0.04 represent dollar amount earned on behalf of each shareholder by the company using each shareholder’s equity.

 f) Price/earnings (P/E) Ratio – is the ratio use to assess the future financial performance of the firm.

Price / earnings = market price per share of common stock earnings per share.
                       
                          = Selling Price / EPS
                               

Note: The Selling price was hardly found in the given data (may be not given in the data) so the Ratio was not calculated.


SUMMARY STATEMENT OF LIHIR GOLD MINE 

A) Liquidity 

Liquidity or Lihir’s ability to meet short term obligations is reasonably not stable and unsecure and there is a short term liquidation problem as observed from liquidity/solvency analysis. It is seen that it will take a long time for Lihir to pay its debt. This is shown by current ratio 0.64 and quick ratio 0.277. Mining’s CF is highly predictable so current ratio of over 1 or 2 is acceptable. Thus Lihir has no short term debt paying ability because current ratio is less than 1. Quick ratio> 1 is desired, so Lihir has no immediate ability to meet current debts.

B) Activity

 Lihir’s inventory appears to be in bad shape and the firm faced problems with account receivables of 103.45 days. Average payment is unacceptable and total assets turnover is not good. However, the average collection period of 5.3 is indicative of good managed credit collection or credit department.

C) Financial Terms

Lihir Mine’s indebtness increase over the year 2005 to 2006. It has no lease payments and the amount of debt is small and can be paid within a short period of time.

 D) Profitability

 Compared to year 2005, Lihir has made great improvement and its net profit was greater than previous year.

Share:

Translate

Welcome

"Welcome to the Mine Waste Management Website. In this site you will discover new and interesting tips about matters related to mine wastes management. You will never regret spending time and contributing in this site as it saves lives of many people in impacted areas. Discover more and contribute Meaningfully to save life."

Featured post

Underground Coal Gasification - Experiment Report (Set-up, Igniting, Recording)

  General information of Coal Gasification  Underground coal gasification is a concept of extracting  underground coal by burning it under...

Related Sites

Contact Us

Name

Email *

Message *